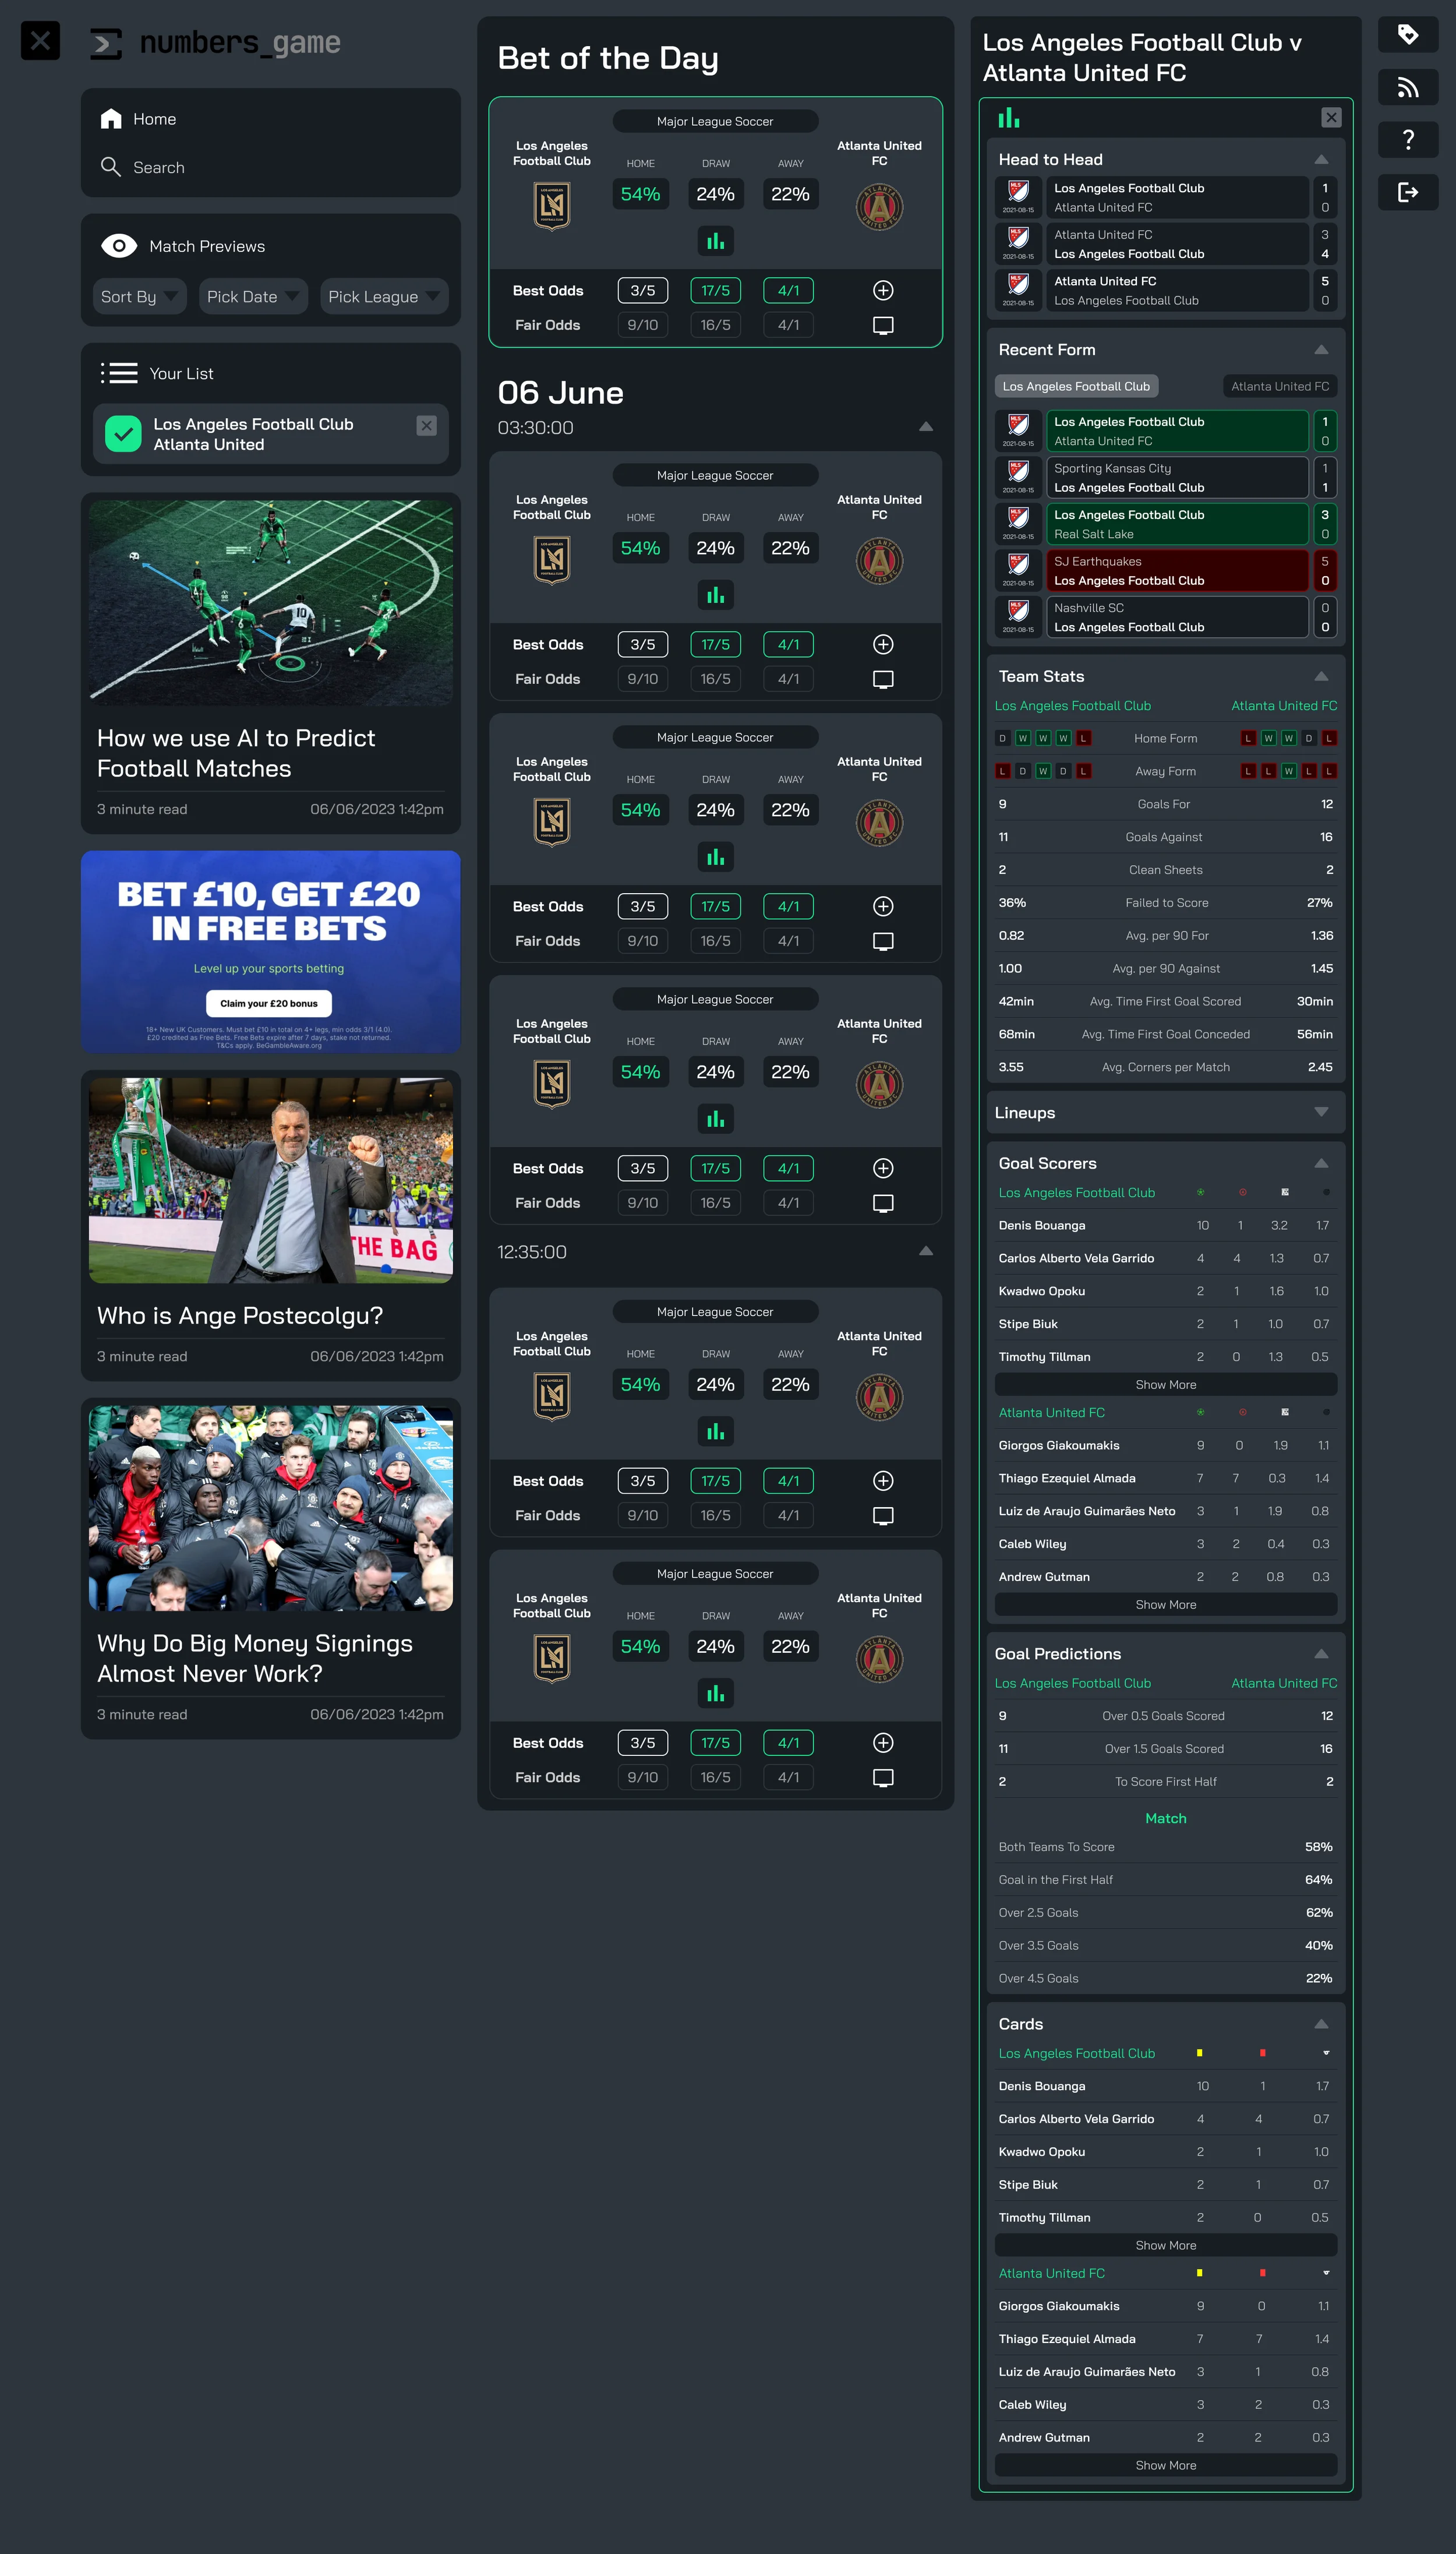
Head to head, form, team stats, scorers, goal markets and cards for every fixture, and none of it on screen until you ask.
Challenge
Football prediction products have more data than any screen can hold. Head to head, recent form, home and away records, goals, corners, scorers, cards. Show all of it and the page becomes a spreadsheet. Hide it and nobody trusts the prediction.
Spotify had just reworked its interface around panels that open and close beside the main view. We wanted to see whether the same composition could carry a data-heavy product, and used an AI-driven football predictions platform as the test case.
Approach
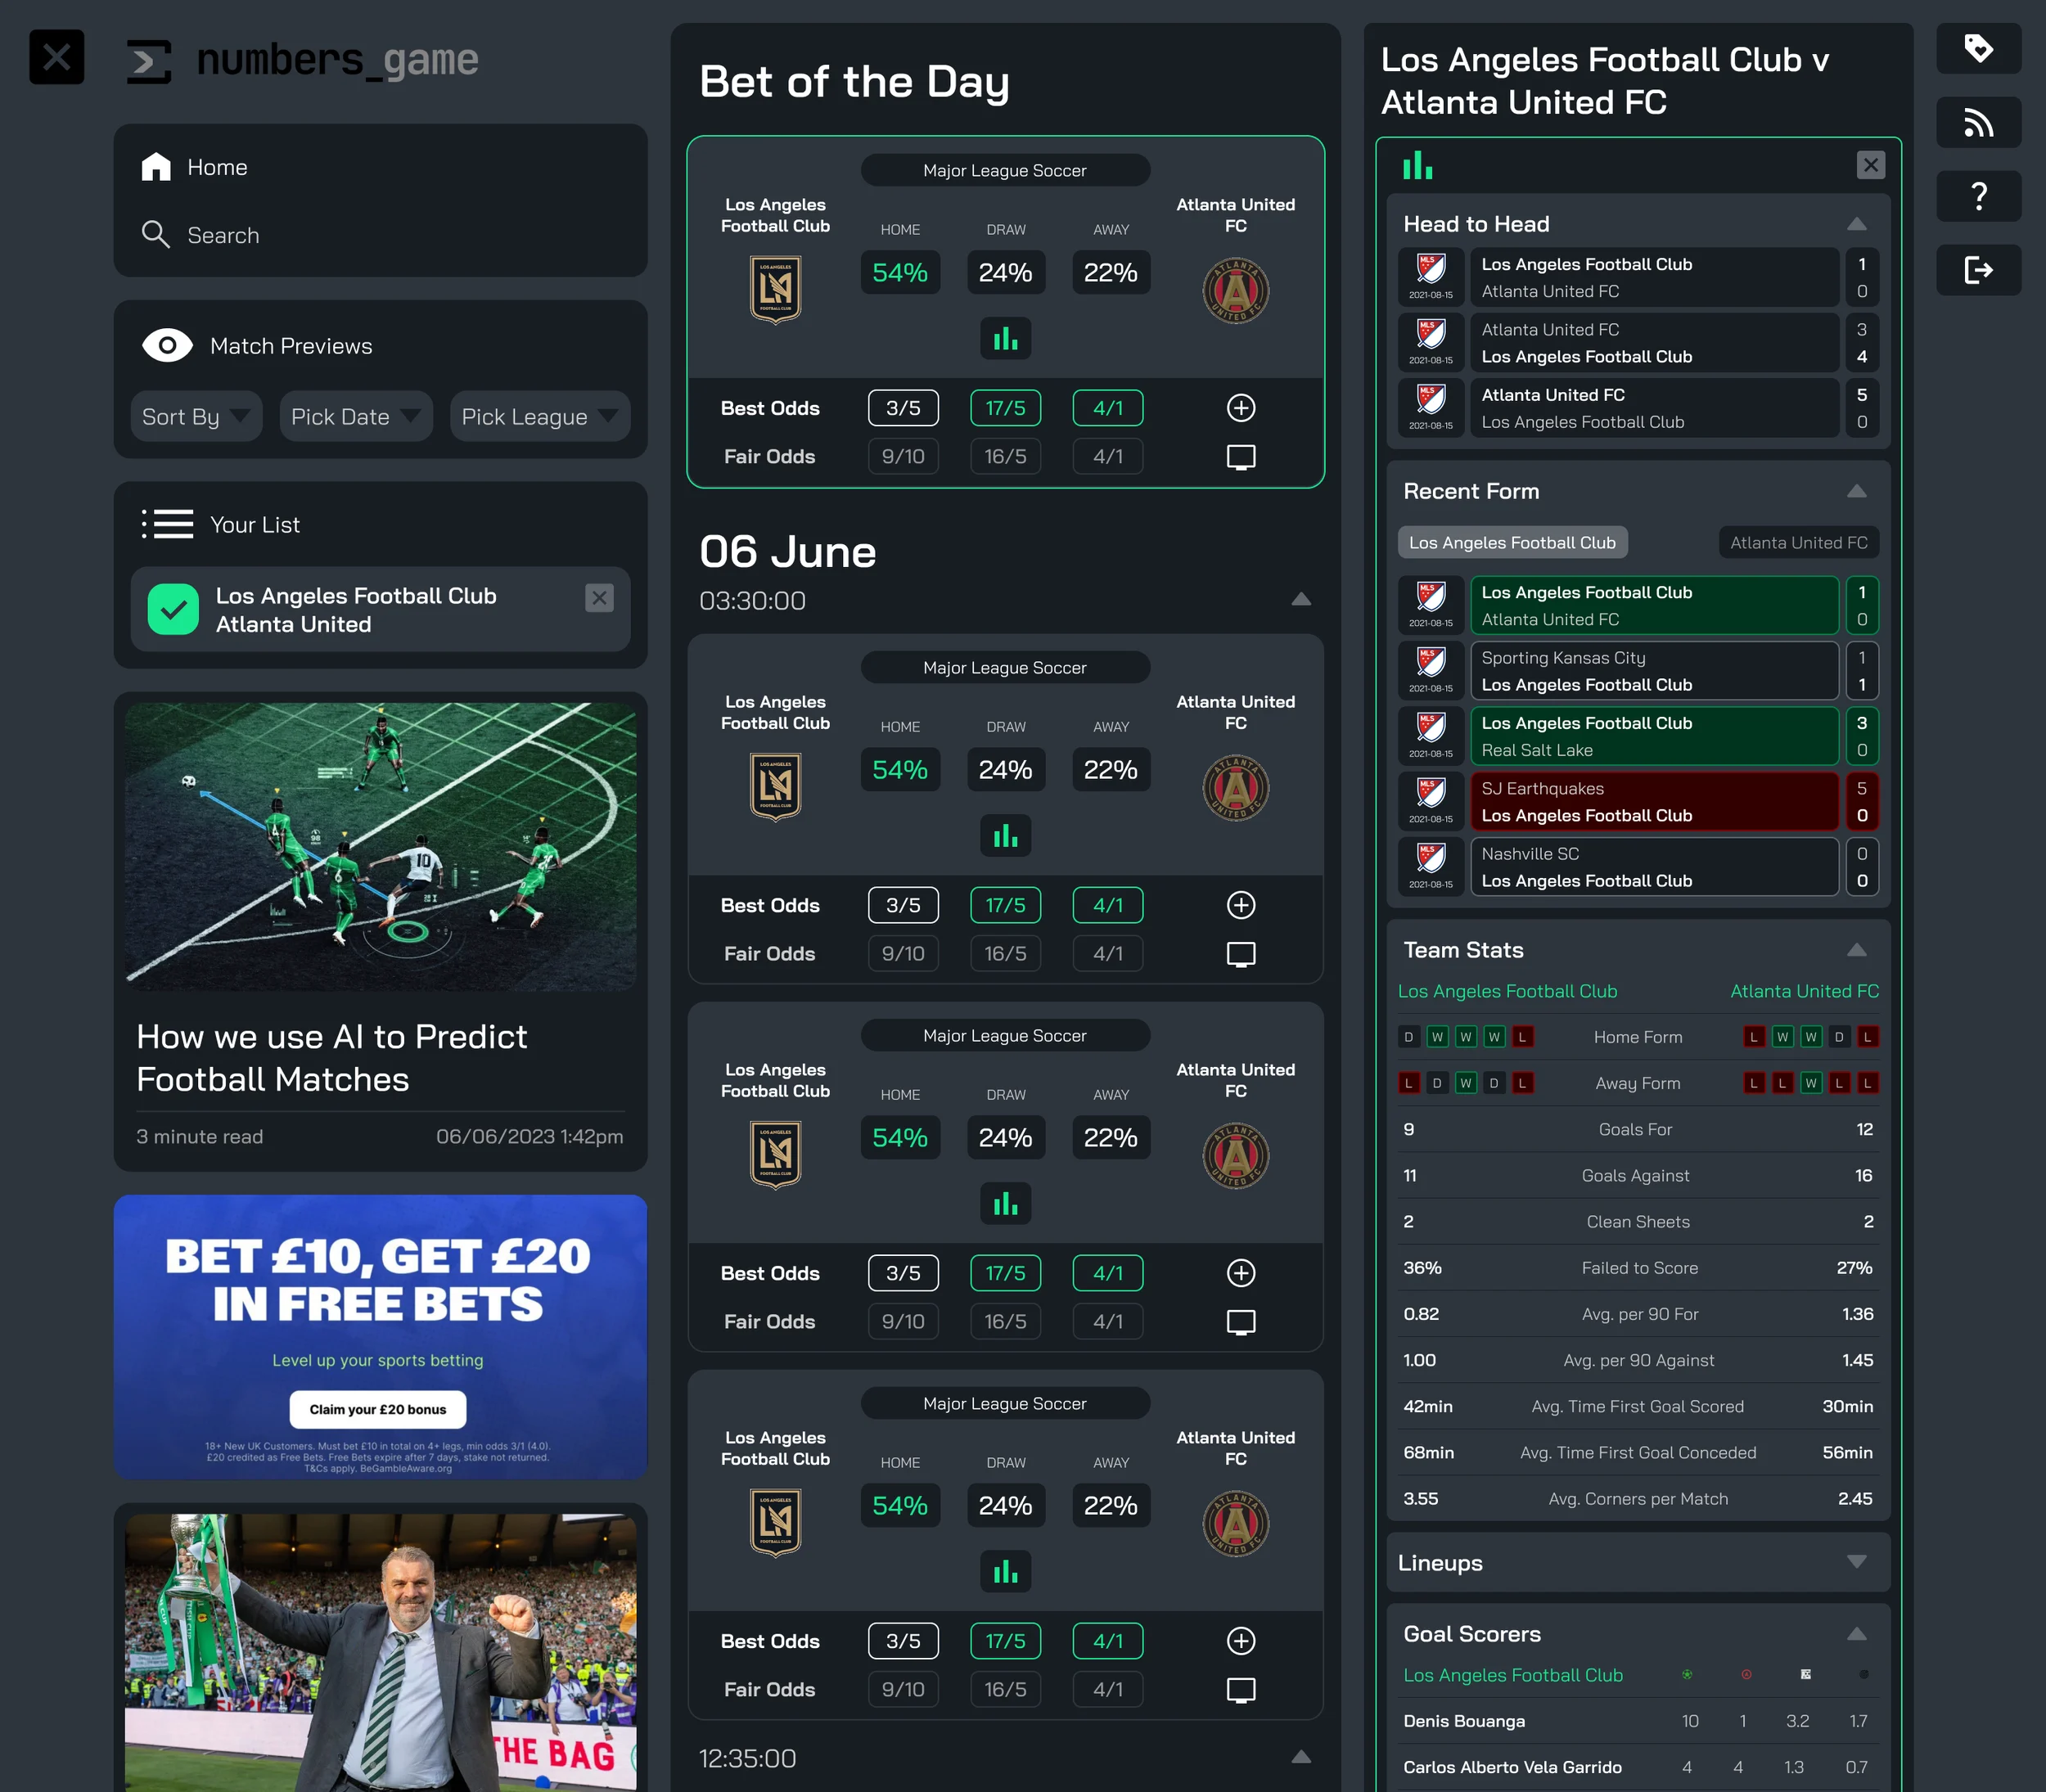
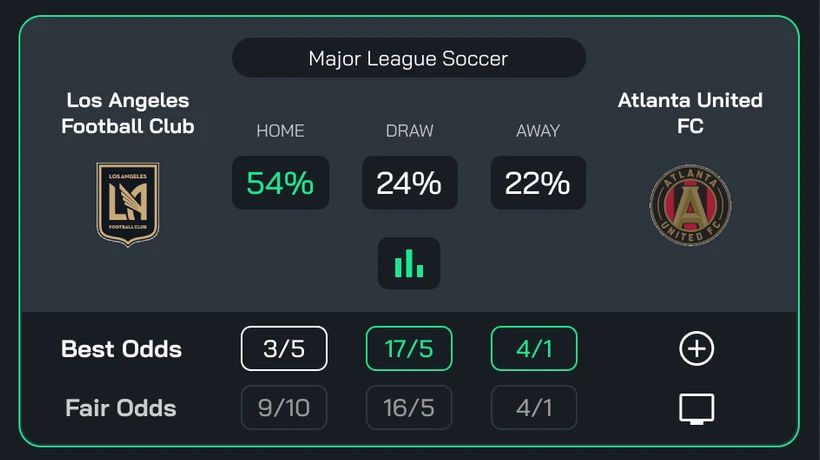
Each fixture is a single card: the model's home, draw and away probabilities, the best price on offer and the fair price beside it. That is enough to decide whether a match is worth a closer look.
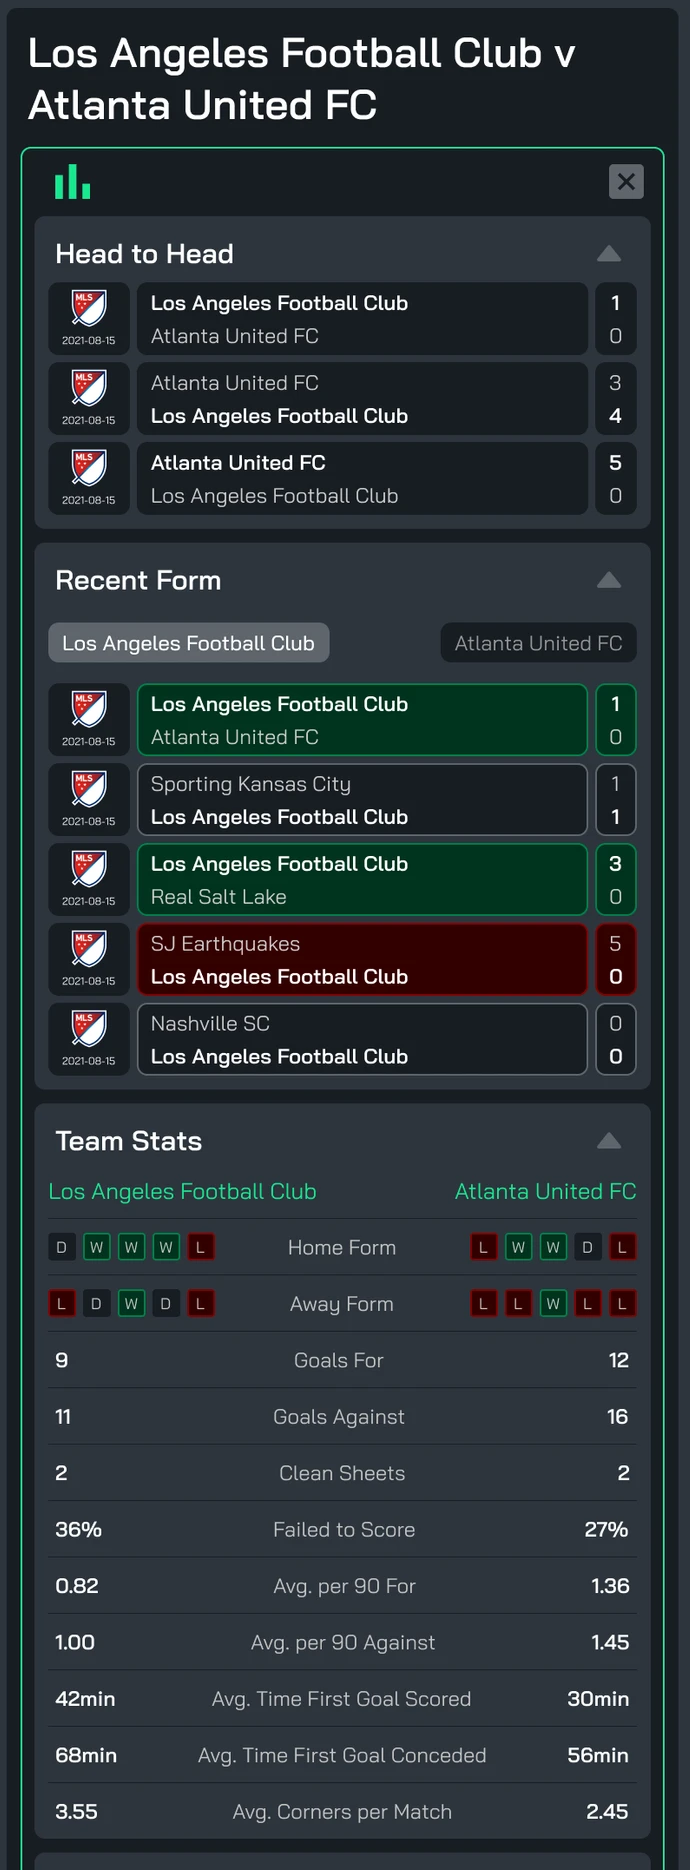
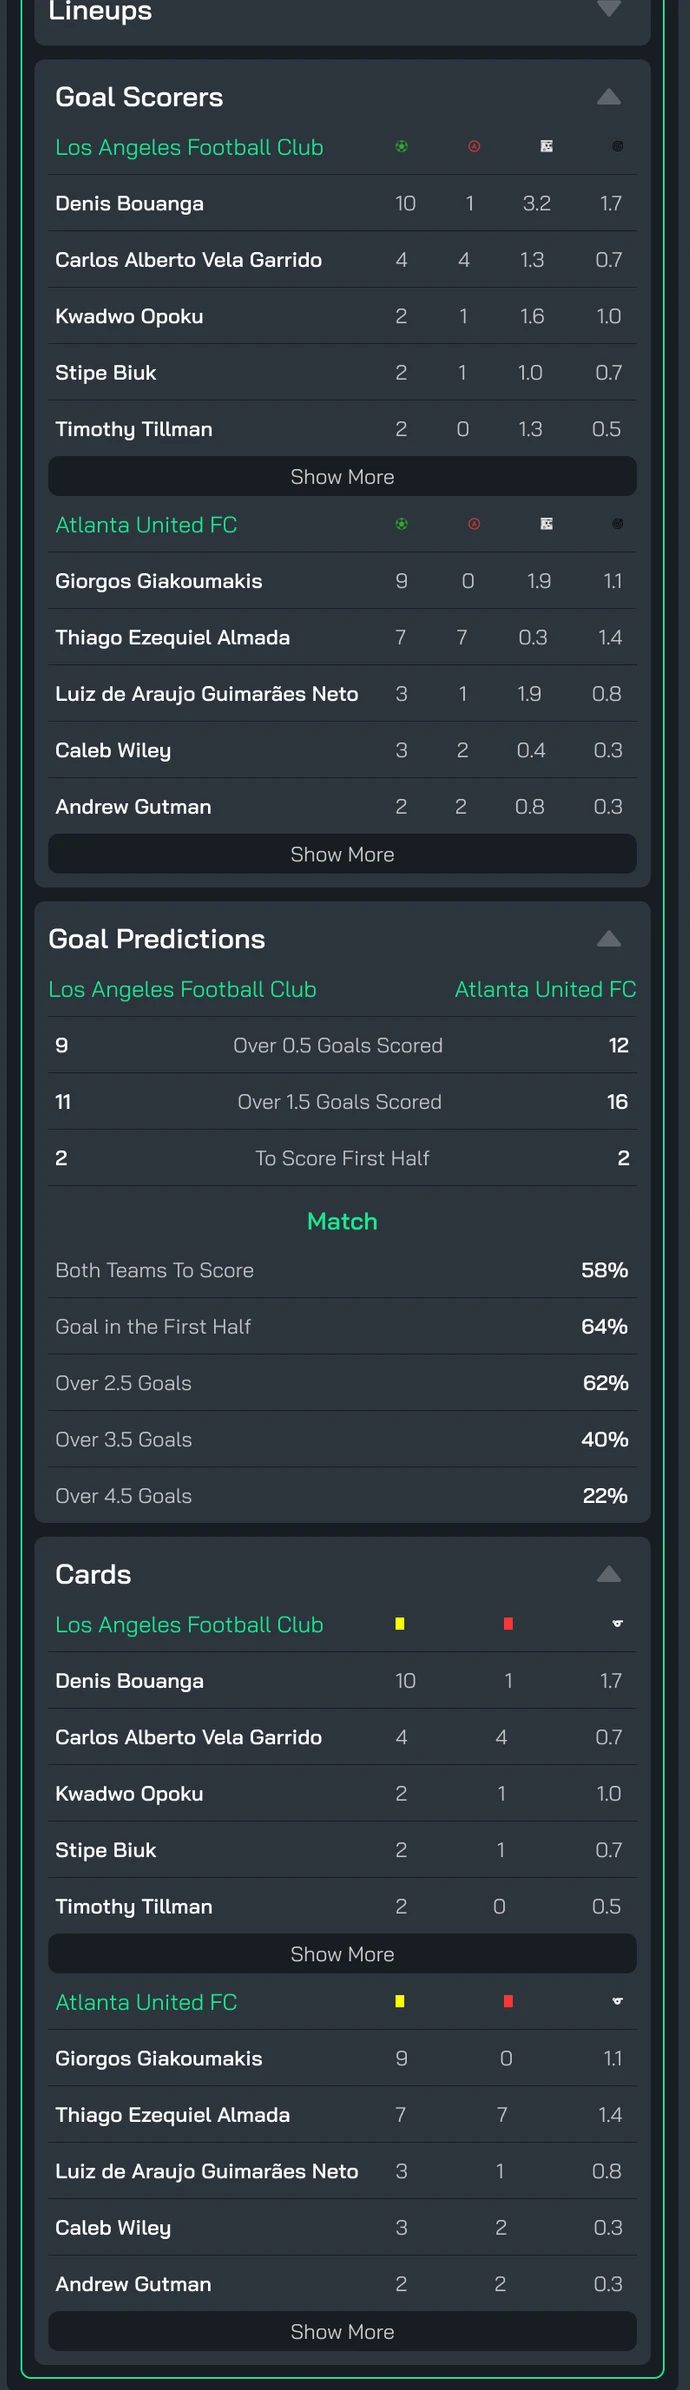
The stats bar in the middle of the card is the only way in. Select it and the match opens in a side panel, broken into sections that expand and collapse independently, so you can keep form and goal predictions open and leave the rest shut.
Your List pins the fixtures you care about, so the panel is never more than one tap from a match you are following.
Outcome
This was a concept, not a shipped product, and the data on screen is illustrative. What it produced was a working prototype and a pattern: summary on the card, depth in a panel, and sections the reader controls.
The prototype is still live in Figma. Select the stats bar on any fixture to open the match.