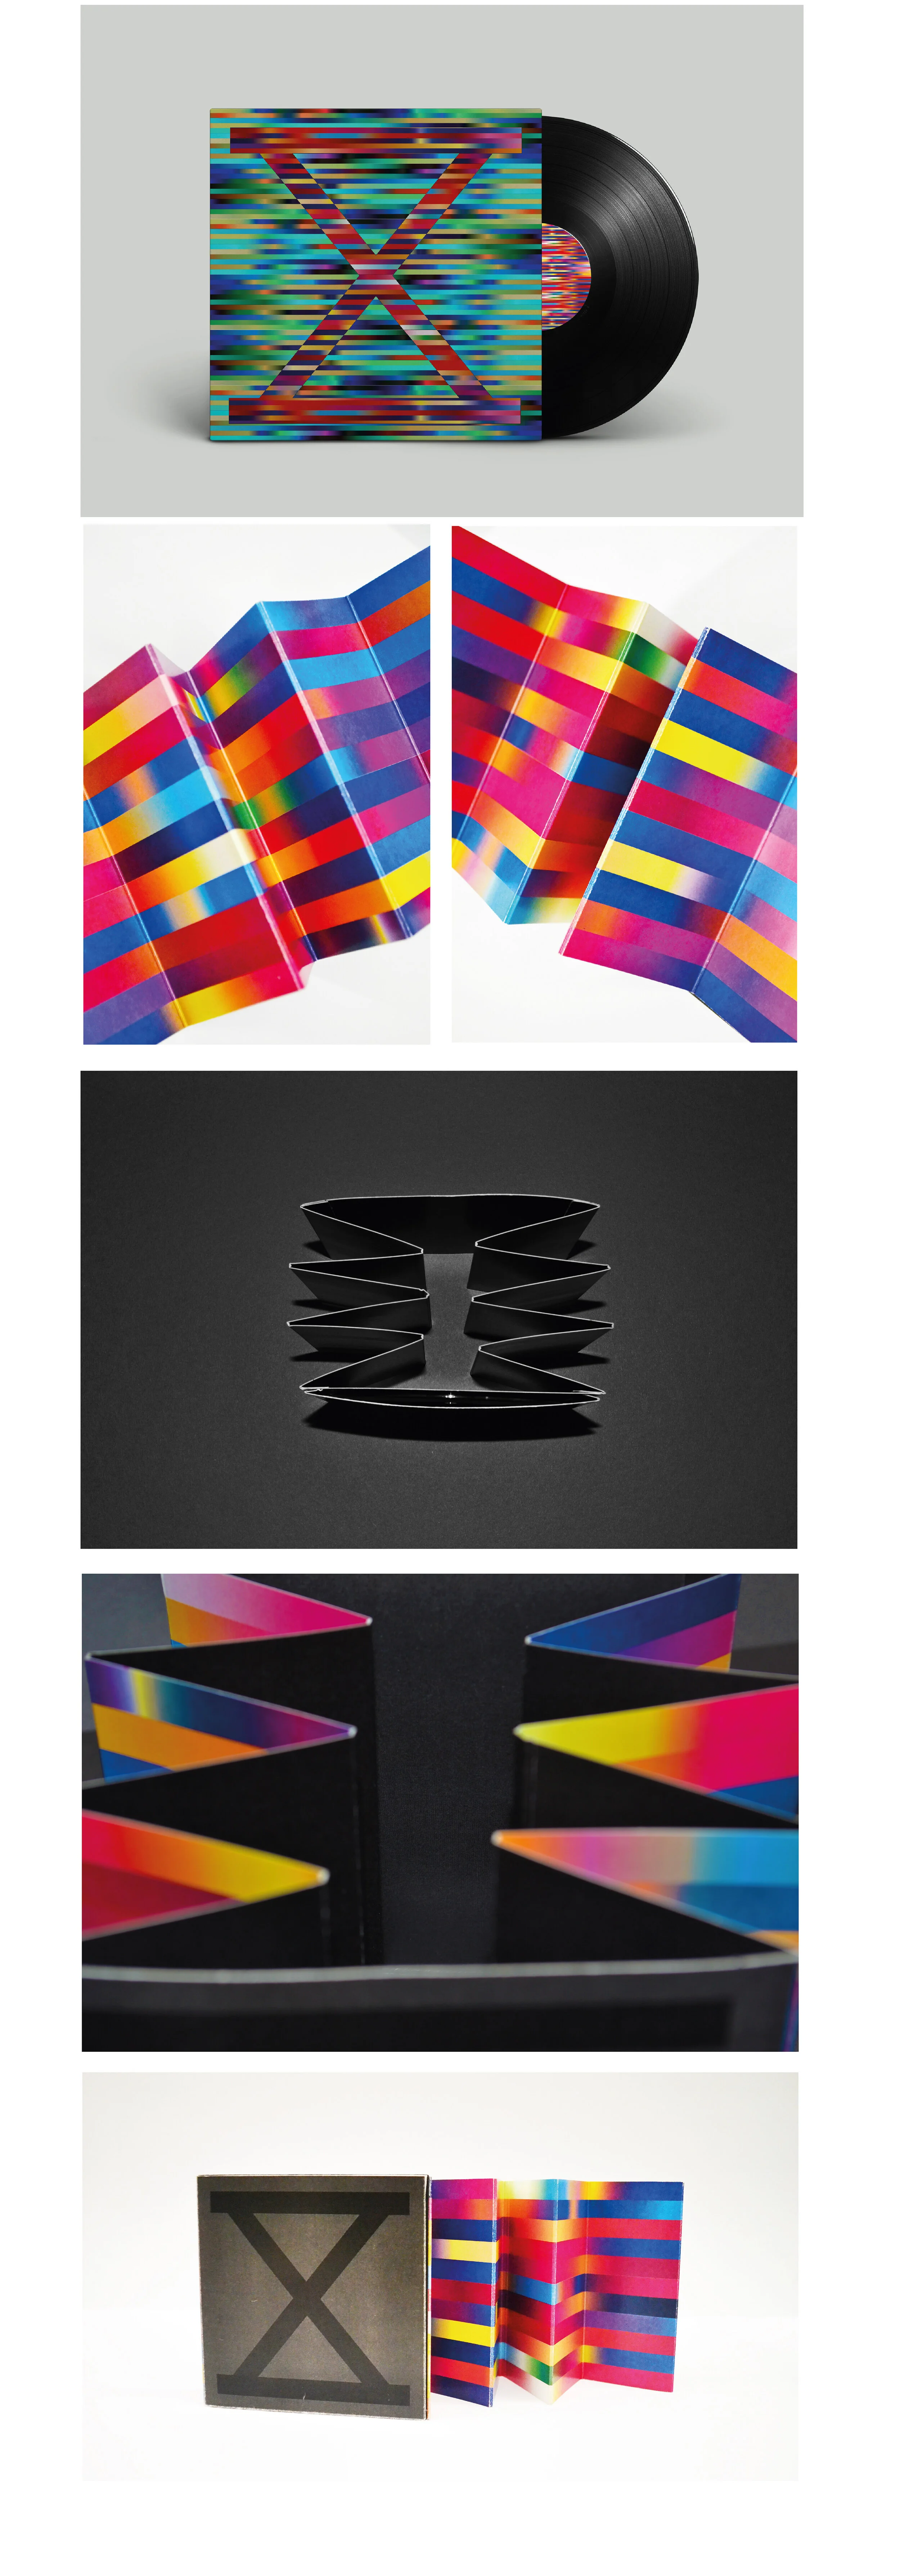
Data visualisation of the song Hourglass - S U R V I V E realised in the shape of a concertina CD case
The project was based on mapping data that could be found from the track. I decided to record how 10 people responded emotionally through colours to certain sounds as the song progressed. The aim was to see if there were patterns within each persons response in certain areas. I found that the most popular response was blue and red shades whereas there was little green envisioned.
From left to right from the cover the concertina displays the 10 participants response to the song from start to finish. I also prototyped what a vinyl cover using the data could have potentially looked like.